|
The task assignment problem (TAP) of this section is the toy problem chosen by
Tank and Hopfield (1987) in their
Scientific American article to illustrate the workings of Hopfield networks on combinatorial cost-optimization problems.
In TAP there are n tasks that must be accomplished by using only
n workers. Each worker performs better at some tasks and worse at others and obviously some workers are better than others at certain tasks. The goal is to minimize the total cost for accomplishing all tasks or, stated differently, to maximize the overall output of all the workers as a whole.
Suppose we had to shelve n book collections in a library using
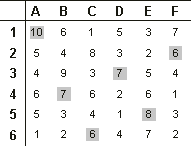
n shelving assistants. Each assistant is familiar with the subject areas to varying degrees and shelves the collections accordingly. The data or fitness cases in the task assignment problem consist of the rates at which books are shelved per minute
(Figure 5).

Figure 5. The task assignment problem. Each assistant (1-6) should be assigned to one collection of books (A-F) based on the rates at which books are shelved per minute (fitness cases). Shaded squares show the best assignment with the largest sum of shelving rates, 44.
For this simple six-by-six problem there are already 6! = 720 possible assignments of assistants to book collections. The best solution has the highest sum of rates for the chosen assistants. For the particular set of fitness cases (see
Figure 5), the best possible solution is known and corresponds to
fmax = 44.
This kind of toy problem is very useful for comparing the performance of different algorithms and, here, the potentialities of inversion are further tested in the context of chromosomes composed of more than one multigene family. Indeed, the task assignment problem is solved very efficiently using only inversion as the source of genetic variation and two MGFs: one to represent the assistants (represented by 1-6) and another to represent the book collections (represented by A-F). The parameters used per run and the success rate for this problem are shown in the second column of
Table 1. Again, selection was made by roulette-wheel sampling coupled with elitism. Note that this problem was efficiently solved using extremely small populations of only 30 individuals evolving for a short period of 50 generations.
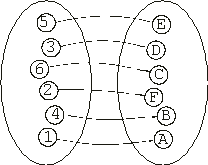
Figure 6 shows the progression of average and best fitness of a successful run. By generation 16 an individual with maximum fitness was found:
|
012345012345
536241EDCFBA |
which corresponds to the best assignment of 44 (see also Figure 5):

It is worth noticing that the evolutionary dynamics shown in Figure 6
is no longer of the type expected for a GA. In fact, it has all the characteristics of GEP dynamics with its oscillatory pattern in average fitness and a considerable gap between best and average fitness
(Ferreira 2002). This kind of dynamics is to be expected due to the higher complexity required to express the chromosomes composed of two multigene families encoding not only the MGFs’ members but also specific interactions between them.

Figure 6. Progression of average fitness of the population and the fitness of the best individual for a successful run of the experiment summarized in
Table 1, column 2 (TAP).
|


