|
GEP Book
Home
News
Author
Q&A
Tutorials
Downloads
GEP Biblio
Contacts
Visit Gepsoft
|
| C. FERREIRA |
In H. J. Caulfield, S.-H. Chen, H.-D. Cheng, R. Duro, V. Honavar, E. E. Kerre, M. Lu, M. G. Romay, T. K. Shih, D. Ventura, P. P. Wang, Y. Yang, eds., Proceedings of the 6th Joint Conference on Information Sciences, 4th International Workshop on Frontiers in Evolutionary Algorithms, pages 614-617, Research Triangle Park, North Carolina, USA, 2002.
|
|
|
|
Mutation, Transposition, and Recombination: An Analysis of the Evolutionary Dynamics
|
|
| Mutation |
| |
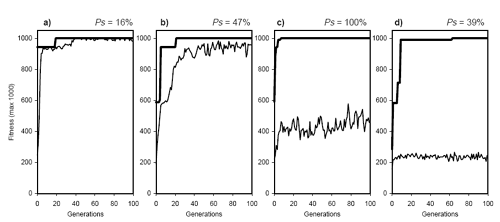
| The evolutionary dynamics of four populations evolving under mutation are shown in
Figure 2. In the first evolutionary dynamics, pm = 0.001, the plot for average fitness closely accompanies the plot for the best fitness and, in later generations, with the exception of a small variation, the plots overlap. These populations are called
Moderately Innovative as they allow the introduction of a little bit of genetic diversity among its members and evolve very sluggishly.

Figure 2. A gallery of evolutionary dynamics found in populations evolving by mutation. The success rate above each plot was determined in the experiment shown in
Figure 1. a) Moderately Innovative dynamics,
pm = 0.001. b) Healthy But Weak dynamics,
pm = 0.005. c) Healthy And Strong dynamics,
pm = 0.1. d) Totally Chaotic dynamics,
pm = 1.0.
In the second dynamics, pm = 0.005, we observe that, although closely accompanying the plot for best fitness, the plot for average fitness never touches the best fitness. Moreover, the oscillatory pattern on average fitness characteristic of GEP populations
[3], is already evident even for such small variation rates. As shown in plot b of
Figure 2, the success rate is in this case 47%. It can be said that, although adaptively healthy, the system is not very efficient. These systems are called
Healthy But Weak. Note that the success rate increases progressively with the mutation rate until it reaches a plateau around
pm = 0.1 and, in terms of dynamics, this is reflected in a more pronounced oscillatory pattern in average fitness and an increase in the gap between both plots. Indeed, around
pm = 0.1 (Figure 2, plot c), the system is at its best with a success rate of 100%. These populations are called
Healthy And Strong. Note that the gap between best and average fitness is considerably wider than in plots a and b, and the capacity to evolve is also higher. Obviously, all populations evolving with maximum performance (approximately from
pm= 0.033 to pm = 0.20) have dynamics of the type
Healthy And Strong.
The last dynamics of Figure 2, pm
= 1.0, is an example of Totally Chaotic systems. Note that, despite elitism, this dynamics is completely chaotic, for elitism is insignificant as each generation a totally random population is generated. Note also the less pronounced oscillatory pattern in average fitness and that the gap between average and best fitness is now maximal.
|
|
|
Home
|
Contents
| Previous
| Next
|
|
