We have already seen that the populations of gene expression programming can be made to evolve efficiently because the genetic operators allow the permanent introduction of new material in the genetic pool. Here we are going to explore this question further, analyzing the variation of success rate with evolutionary time.
In this section, again was used the sequence induction problem of section 4.2.2 as it is a considerably difficult problem with an exact solution.
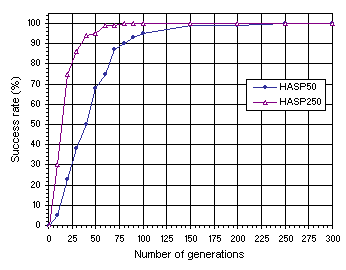
In the first analysis, the dependence of success rate on evolutionary time was analyzed for healthy and strong populations of 50 and 250 individuals each
(Figure 7.13). In this experiment, all genetic operators were switched on. The rates used are shown in the first column of
Table 7.6.

Figure 7.13. Variation of success rate with evolutionary time for healthy and strong populations of 50 (HASP50) and 250 individuals (HASP250). The success rate was evaluated over 100 identical runs.
Note that after 150 generations the success rate practically reached the maximum value for both systems. As expected, the performance, measured exclusively in terms of success rate, is superior for the system with bigger populations. However, if we compare the CPU time required for each system we will see that the 50-chromosome system is more efficient. For instance, 100 runs of 150 generations take 1’30’’ for the 50-chromosome system and 3’55’’ for populations of 250 individuals. However, if we disable the stop
criterion (i.e., the system does not stop when a perfect solution is found) and let the system go through all of the 150 generations, we obtain the values of 4’14’’ for populations of 50 individuals and 29’42’’ for populations of 250 individuals. This is no idle comparison as in real-world problems perfect solutions (i.e., solutions with 0% or 0.01% of error) do not usually exist and the system does not stop before completing the stipulated number of generations.
Table 7.6
Sources of genetic variation used in healthy and strong populations
(HASP) and homogenizing populations (HP).
| |
HASP |
HP |
| Number
of runs |
100 |
100 |
| Number
of fitness cases |
10 |
10 |
| Function
set |
+
- * / |
+
- * / |
| Head
length |
7 |
7 |
| Number
of genes |
5 |
5 |
| Linking
function |
+ |
+ |
| Chromosome
length |
75 |
75 |
| Mutation
rate |
0.044 |
-- |
| One-point
recombination rate |
0.3 |
1.0 |
| Two-point
recombination rate |
0.3 |
1.0 |
| Gene
recombination rate |
0.1 |
1.0 |
| IS
transposition rate |
0.1 |
-- |
| IS
elements length |
1,2,3 |
-- |
| RIS
transposition rate |
0.1 |
-- |
| RIS
elements length |
1,2,3 |
-- |
| Gene
transposition rate |
0.1 |
-- |
| Selection
range |
25% |
25% |
| Precision |
0% |
0% |
In summary, in GEP, as long as mutation is used, it is advantageous to use small populations of 30-100 individuals for they allow an efficient evolution in record time.
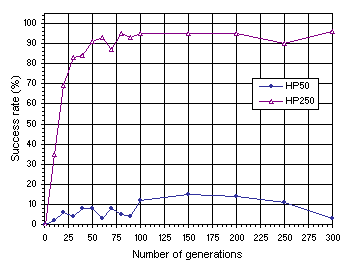
These facts are corroborated by the second experiment where only recombination was used as source of genetic diversity
(Figure 7.14). The types of recombination used and their rates are shown in the second column of
Table 7.6.

Figure 7.14. Variation of success rate with evolutionary time for homogenizing populations of 50 (HP50) and 250 individuals (HP250). The success rate was evaluated over 100 identical runs.
This analysis clearly shows the importance of the permanent introduction of genetic variation through mutation and similar non-homogenizing operators such as RIS or IS transposition. Note that populations of 50 individuals evolve, in this case, very inefficiently. And the often spoken fatalist remark about the inability of GP populations to evolve beyond 50 generations can be fully understood. As
Figure 7.14 emphasizes, homogenizing systems show no appreciable increase in success rate after 50 generations. Remember that GP uses almost exclusively a GP-specific recombination as the only source of genetic variation. Here we can see that even recombinational mechanisms more disruptive than the recombination used in GP (namely, one-point and two-point recombination), are inadequate to make populations evolve efficiently. This obviously accounts for some of the superiority of GEP over GP, although, of course, the most important is the genotype/phenotype representation and all the things this representation brought with itself. The plot for the 250-members population indicates that only the use of huge population sizes will permit an efficient evolution in those systems. Note, however, that not even for such large population sizes was it possible to surpass the results obtained for populations of only 50 individuals when mutation and transposition were switched on (see
Figure 7.13).
|

