We have already seen in the previous section the limits of recombination of building blocks. When systems rely exclusively on existing building blocks and are incapable of creating new ones through mutation or other mechanisms, they become severely constrained. Here, we will pursue this question further, comparing three different systems: one that constantly introduces variation in the population, and two different systems that can only recombine a particular kind of building block – GEP genes. Recall that GEP genes have defined boundaries and, through gene recombination and gene transposition, it is possible to test new combinations of these building blocks without disrupting them.
For this analysis we are going to work with the same sequence induction problem of the
previous section, using the general settings presented in
Table 7.3. For the first experiment, we are going to use a mix of all the genetic operators; for the second, we are going to use solely gene recombination at
pgr = 1.0; and for the last experiment, we are going to allow a more generalized shuffling of building blocks by combining gene recombination (pgr
= 1.0) with gene transposition (pgt = 0.5).
Table 7.3
Parameters for a healthy and strong system undergoing several kinds of genetic modification
(All Op) and two other systems evolving exclusively by recombining genes (GR and
GR+GT).
| |
All
Op |
GR |
GR+GT |
| Number
of runs |
100 |
100 |
100 |
| Number
of generations |
50 |
50 |
50 |
| Number
of fitness cases |
10 |
10 |
10 |
| Function
set |
+
- * / |
+
- * / |
+
- * / |
| Head
length |
6 |
6 |
6 |
| Number
of genes |
4 |
4 |
4 |
| Linking
function |
+ |
+ |
+ |
| Chromosome
length |
52 |
52 |
52 |
| Mutation
rate |
0.0384 |
-- |
-- |
| One-point
recombination rate |
0.3 |
-- |
-- |
| Two-point
recombination rate |
0.3 |
-- |
-- |
| Gene
recombination rate |
0.1 |
1.0 |
1.0 |
| IS
transposition rate |
0.1 |
-- |
-- |
| IS
elements length |
1,2,3 |
-- |
-- |
| RIS
transposition rate |
0.1 |
-- |
-- |
| RIS
elements length |
1,2,3 |
-- |
-- |
| Gene
transposition rate |
0.1 |
-- |
0.5 |
| Selection
range |
25% |
25% |
25% |
| Precision |
0% |
0% |
0% |
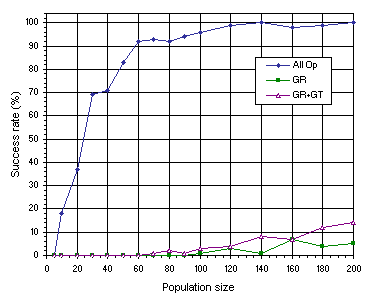
In this analysis, instead of creating a founder population as was done in the
previous section, we are going to study the progression of success rate with population size
(Figure 7.10). As you can see, this study emphasizes further the results obtained in the
previous section: systems incapable of introducing constantly new genetic material in the genetic pool evolve poorly. Furthermore, if the building blocks are only moved around and not somehow disrupted, the system is practically incapable of evolving. Only by using relatively big populations was it possible to solve this simple problem, albeit very inefficiently, when only the moving around of building blocks was available. Remember, though, that real-world problems are much more complex than the problem analyzed here and, therefore, more powerful search operators such as mutation should always be used.

Figure 7.10. Dependence of success rate on population size in healthy and strong populations evolving under a mix of several operators (All Op) and populations evolving exclusively by recombining genes (GR:
pgr = 1.0; and GR+GT: pgr = 1.0 and
pgt = 0.5). The success rate was evaluated over 100 identical runs.
In summary, the moving around of building blocks (Holland
1975) has only a limited evolutionary impact: without mutation (or other non-homogenizing operators) adaptation is so slow and requires such numbers of individuals that it becomes ineffective.
|
