The aim of this section consists of studying a successful run in its entirety in order to understand how populations adapt, finding in the process perfect or good solutions to a problem.
In symbolic regression or function finding the goal is to find an expression that satisfactorily explains the dependent variable. The input into the system is a set of fitness cases in the form
(a(i,0), a(i,1),...,
a(i,n-1), yi) where
a(i,0) - a(i,n-1) are the
n independent variables and
yi is the dependent variable. We have already seen that the set of
Ct fitness cases consists of the environment in which solutions (computer programs or the output of the system) adapt, discovering good solutions to the problem at hand.
In the simple example of this section, the fitness cases were computer generated using a test function. So, in this case, we know exactly how the perfect solution to our problem looks like. And, in this case, this is a good thing because then we can pay due homage to the results produced by the blind action of the genetic operators. Keep in mind, however, that in real-world problems the target function is obviously unknown.
So, let us suppose we are given a sampling of the numerical values from the curve:
|

|
(3.3) |
over 10 randomly chosen points in the real interval [-10, +10] and we wanted to find a function fitting those values within a certain error. In this case, we are given a sample of data in the form of 10 pairs (ai,
yi), where ai is the value of the independent variable in the given interval and
yi is the respective value of the dependent variable
(Table 3.2). These 10 pairs are the fitness cases (the input to the system) that will be used as the selection environment and, hopefully, after a certain number of generations, the better adapted individual will be a perfect solution to our problem. The fitness of a particular program will depend on how well it performs in this selection environment.
Table 3.2
Set of 10 random, computer generated fitness cases used in the simple problem of symbolic regression.
|
a
|
f(a)
|
| 6.9408 |
44.90975 |
| -7.8664 |
7.340925 |
| -2.7861 |
-4.47712 |
| -5.0944 |
-2.30674 |
| 9.4895 |
73.49381 |
| -9.6197 |
17.41021 |
| -9.4145 |
16.07291 |
| -0.1432 |
-0.41935 |
| 0.9107 |
3.146787 |
| 2.1762 |
8.896523 |
There are five major steps in preparing to use gene expression programming. The first is to choose the fitness function. For this problem we will measure the fitness by equation
(3.1a), using an absolute error of 100 as the selection range and a precision for the error equal to 0.01. Thus, for 10 fitness cases
fmax = 1000.
The second major step is to choose the set of terminals T and the set of functions
F. In this problem, the terminal set consists obviously of the independent variable and, therefore,
T = {a}. The choice of the appropriate function set is not so obvious, but a good guess can be done so that all the necessary mathematical operators are included. In this problem, we will use the four arithmetic operators. Thus,
F = {+, -, *, /}.
The third major step is to choose the chromosomal architecture: the length of the head and the number of genes. In this problem we will use an
h = 7 and three genes per chromosome.
The fourth major step is to choose the kind of linking function. In this case we will link the sub-ETs by addition.
And finally, the fifth major step in preparing to use GEP is to choose the set of genetic operators and their rates. In this case we will use a combination of all the genetic operators introduced in the
previous section (mutation, the three kinds of transposition, and the three kinds of recombination).
The parameters used per run are summarized in Table
3.3. For this problem, a small population of 20 individuals was chosen so that all the individuals created in the evolutionary process could be completely analyzed, without however filling this book with pages of encoded individuals. However, as we will see, one of the advantages of gene expression programming is that it is capable of solving relatively complex problems using small population sizes and, thanks to the compact Karva notation, it is possible to analyze every single individual from a run.
Table 3.3
Parameters for the simple symbolic regression problem.
| Number
of generations |
50 |
| Population
size |
20 |
| Number
of fitness cases |
10 (Table
3.2) |
| Function
set |
+
- * / |
| Terminal
set |
a |
| Head
length |
7 |
| Number
of genes |
3 |
| Linking
function |
+ |
| Chromosome
length |
45 |
| Mutation
rate |
0.044 |
| One-point
recombination rate |
0.4 |
| Two-point
recombination rate |
0.2 |
| Gene
recombination rate |
0.1 |
| Gene
transposition rate |
0.1 |
| IS
transposition rate |
0.1 |
| IS
elements length |
1,2,3 |
| RIS
transposition rate |
0.1 |
| RIS
elements length |
1,2,3 |
| Selection
range |
100 |
| Precision |
0.01 |
Figure 3.26 shows the progression of average fitness and the fitness of the best individual of the successful run we are going to analyze in this section. In this run, a perfect solution was found in generation
10.
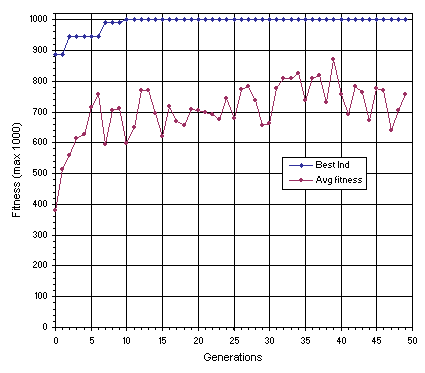
Figure 3.26. Progression of average fitness of the population and the fitness of the best individual for a successful run of the experiment summarized in
Table 3.3.
The initial population of this run and the fitness of each individual in the particular environment of
Table 3.2, is shown below (the best of generation is shown in
blue):
|
Generation N: 0
012345678901234012345678901234012345678901234
-/a+*+*aaaaaaaa*++*/a+aaaaaaaa+++a*--aaaaaaaa-[ 0] = 285.2363
+a-*/+aaaaaaaaa+/*+/+*aaaaaaaa+/++++/aaaaaaaa-[ 1] = 324.4358
--a+a/*aaaaaaaa+a-/aa/aaaaaaaa***-+a+aaaaaaaa-[ 2] = 697.6004
++//a*aaaaaaaaa/aa/+*+aaaaaaaa-++*/+-aaaaaaaa-[ 3] = 711.1687
/*+-*a/aaaaaaaa*+a/-*aaaaaaaaa*////-aaaaaaaaa-[ 4] = 730.5334
-a/a/+*aaaaaaaa*+-*a*-aaaaaaaa/*/**aaaaaaaaaa-[ 5] = 256.4514
/*+*/++aaaaaaaa-/*-a-*aaaaaaaa*++--/*aaaaaaaa-[ 6] = 821.6851
**+//++aaaaaaaa*aa+++/aaaaaaaa+++a/aaaaaaaaaa-[ 7] = 816.0122
/*-/+++aaaaaaaa//-+aa/aaaaaaaa+a+--a-aaaaaaaa-[ 8] = 0
-+/a-/*aaaaaaaa-a-a+a/aaaaaaaa-/+*a//aaaaaaaa-[ 9] = 729.2897
--//+/*aaaaaaaa-***/a+aaaaaaaa+-*/*+/aaaaaaaa-[10] = 376.2071
**+/+*aaaaaaaaa/+*-/-*aaaaaaaa*a**a+aaaaaaaaa-[11] = 0
-aa-+/+aaaaaaaa+a/*-a*aaaaaaaa-a*//++aaaaaaaa-[12] = 0
-a+a+//aaaaaaaa*-aa/+/aaaaaaaa--/*a+-aaaaaaaa-[13] = 0
+/*a+/-aaaaaaaa-/*--/-aaaaaaaa**a/**aaaaaaaaa-[14] = 0
-a+*a**aaaaaaaa+-***a*aaaaaaaa-/+-+a/aaaaaaaa-[15] = 294.7556
/+-***-aaaaaaaa+a/a/+*aaaaaaaa*-*-a*-aaaaaaaa-[16] = 886.7593
/a++/--aaaaaaaa*-a/a-/aaaaaaaa*/+*+*/aaaaaaaa-[17] = 392.185
+a-+/+/aaaaaaaa*--a**/aaaaaaaa/---+/-aaaaaaaa-[18] = 311.389
/*/aa*-aaaaaaaa/-+--+*aaaaaaaa*/-+*a/aaaaaaaa-[19] = 0
|
Note that six out of 20 individuals are nonviable and thus have fitness 0, meaning that either they could not solve a sole fitness case within the chosen selection range or they returned calculation errors such as division by zero. In fact, all calculation errors in GEP are handled similarly: every time a program gives a calculation error it is made nonviable. This means that it will not be able to pass on its genes to the next generation. This is a good alternative to the creation of useless programs with dubious protected mathematical operators as is done in GP.
As shown in the initial population above, the best individual of this generation, chromosome 16, has fitness 886.7593. Let us analyze its performance more closely.
Table 3.4 compares the results returned by this program with the target value. Note that none of the fitness cases was solved within the chosen precision of 0.01. However, in all cases, the absolute error was within the chosen selection range of 100.
Table 3.4
Fitness evaluation of a model (best program of generation 0).
| Target |
Model |
Error |
Fitness |
| 44.91 |
33.0282 |
11.8818 |
88.1182 |
| 7.341 |
25.0737 |
17.7327 |
82.2673 |
| -4.477 |
3.09508 |
7.57208 |
92.42792 |
| -2.307 |
9.88206 |
12.18906 |
87.81094 |
| 73.494 |
56.5148 |
16.9792 |
83.0208 |
| 17.41 |
38.6496 |
21.2396 |
78.7604 |
| 16.073 |
36.9019 |
20.8289 |
79.1711 |
| -0.419 |
1.86705 |
2.28605 |
97.71395 |
| 3.147 |
3.32539 |
0.17839 |
99.82161 |
| 8.897 |
6.54412 |
2.35288 |
97.64712 |
The expression of the best individual of this generation and the corresponding mathematical expression is shown in
Figure 3.27. Note that gene 3 does nothing, and therefore may be considered a neutral gene. Note also the creation of numerical constants in
sub-ET1 and sub-ET2 as a result of simple arithmetic manipulations.
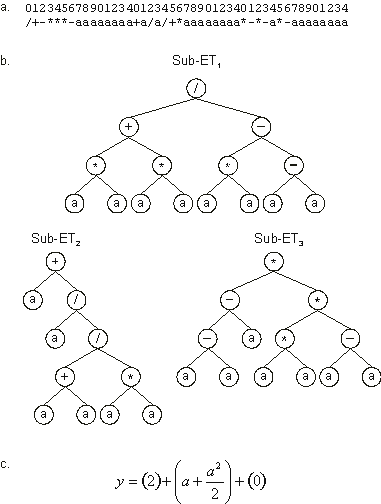
Figure 3.27. Best individual of generation 0 (chromosome 16). It has a fitness of 886.7593 evaluated against the set of fitness cases presented in
Table 3.2. a) The chromosome of the individual.
b) The sub-ETs codified by each gene. c) The corresponding mathematical expression after linking with addition (the contribution of each sub-ET is shown in brackets). Note that gene 3 is a neutral gene.
The descendants of the individuals of the initial population are shown below (the best of generation are shown in
blue):
|
Generation N: 1
012345678901234012345678901234012345678901234
/+-***-aaaaaaaa+a/a/+*aaaaaaaa*-*-a*-aaaaaaaa-[ 0] = 886.7593
++//a*aaaaaaaaa-a-++a/aaaaaaaa*-/+*a/aaaaaaaa-[ 1] = 366.9803
+a/+/+/aaaaaaaa*--a**/aaaaaaaa/----/*aaaaaaaa-[ 2] = 313.1345
-+/a-/*aaaaaaaa/aa/+*+aaaaaaaa-++*/+/aaaaaaaa-[ 3] = 650.7792
-a+*a**aaaaaaaa+-***a*aaaaaaaa-/+-*aaaaaaaaaa-[ 4] = 297.1939
++//a*aaaaaaaaa**+//*/aaaaaaaa/--*+/-aaaaaaaa-[ 5] = 462.7996
*aa+++/aaaaaaaa/aa/+++aaaaaaaa-/+*a//aaaaaaaa-[ 6] = 756.707
--a+a/*aaaaaaaaaa-/a*/aaaaaaaa***--a+aaaaaaaa-[ 7] = 697.6004
**+*+*/aaaaaaaa/a++/--aaaaaaaa*-a/a-/aaaaaaaa-[ 8] = 199.4485
/*+*-*+aaaaaaaa-/*-a-*aaaaaaaa*-+-+/-aaaaaaaa-[ 9] = 794.29
-/a+*+*aaaaaaaa*++*/a+aaaaaaaa+++a*--aaaaaaaa-[10] = 285.2363
/+-***-aaaaaaaa+a/a/+*aaaaaaaa*-*-a*-aaaaaaaa-[11] = 886.7593
++//a*-aaaaaaaa/aa/+*+aaaaaaaa-++*/+-aaaaaaaa-[12] = 0
/a++/--aaaaaaaa*/-a/a-aaaaaaaa*/+*+*/aaaaaaaa-[13] = 446.7045
-+a-/*aaaaaaaaa-a-a+a/aaaaaaaa-/+*a//aaaaaaaa-[14] = 730.5334
/*+**a/aaaaaaaa*+a--*aaaaaaaaa*////-aaaaaaaaa-[15] = 334.3612
-a/a/+*aaaaaaaa*+-*a*-aaaaaaaa/*/*+a/aaaaaaaa-[16] = 314.1658
-+/a-/*aaaaaaaa-a-a+a/aaaaaaaa+++a/aaaaaaaaaa-[17] = 716.5283
+a-+/+/aaaaaaaa*-+a**+aaaaaaaa-++*/+aaaaaaaaa-[18] = 361.1277
/+-***-aaaaaaaa+a/a/a*aaaaaaaa-**-*-aaaaaaaaa-[19] = 738.8981
|
Note that despite the global improvement (compare the average fitness of both populations in
Figure 3.26), none of the descendants surpassed the best individual of the previous generation. In fact, the best individuals of generation 1 have exactly the same genetic makeup of the best of generation 0. The first one, chromosome 0, was generated by elitism. The other one, chromosome 11, managed to get reproduced with no change.
In the next generation a new individual was created, chromosome 8, considerably better than the best individual of the previous generation. Its expression is shown in
Figure 3.28. The complete population is shown below (the best of generation is shown in
blue):
|
Generation N: 2
012345678901234012345678901234012345678901234
/+-***-aaaaaaaa+a/a/+*aaaaaaaa*-*-a*-aaaaaaaa-[ 0] = 886.7593
/+-***-aaaaaaaa+a/a/+*aaaaaaaa*-*-a*-aaaaaaaa-[ 1] = 886.7593
/+-**+-aaaaaaaa+a/a/+*aaaaaaaa*---a*-aaaaaaaa-[ 2] = 361.2925
/+a/**-aaaaaaaa+a/a/+*aaaaaaaa*-**a//aaaaaaaa-[ 3] = 0
*-*-a*-aaaaaaaa/+-*a+aaaaaaaaa***--a+aaaaaaaa-[ 4] = 822.5905
+a/+/+/aaaaaaaa*--a**/aaaaaaaa/----/*aaaaaaaa-[ 5] = 313.1345
/a++*--aaaaaaaa*/-a/a-aaaaaaaa*/+*+*/aaaaaaaa-[ 6] = 449.5403
*+-***-aaaaaaaa+a/a/a*aaaaaaaa-**-*-aaaaaaaaa-[ 7] = 256.8001
/*+*-*+aaaaaaaa+a/a/+*aaaaaaaa-/+*a//aaaaaaaa-[ 8] = 945.8432
-+a-/*aaaaaaaaa---a+a/aaaaaaaa-/+*a//aaaaaaaa-[ 9] = 611.6426
*/*/**+aaaaaaaa/a++/--aaaaaaaa*-a/a-/aaaaaaaa-[10] = 475.9649
/+-***-aaaaaaaa+a/a/+*aaaaaaaa*-a-a*-aaaaaaaa-[11] = 372.5987
-+a-/*aaaaaaaaa-a-a+a/aaaaaaaa*-+-+/-aaaaaaaa-[12] = 611.6426
/a++/--aaaaaaaa*--a/a/aaaaaaaa*/+*+*/aaaaaaaa-[13] = 458.072
*aa+/+/aaaaaaaa*/-a/a-aaaaaaaaa/+*+//aaaaaaaa-[14] = 471.6405
aa-/aa/aaaaaaaa--a+**-aaaaaaaa+**a/a/aaaaaaaa-[15] = 804.8516
++//aaaaaaaaaaa**+//*/aaaaaaaa//-a+/-aaaaaaaa-[16] = 723.8981
/+-***-aaaaaaaa+a/a/+*aaaaaaaa*-*-a*-aaaaaaaa-[17] = 886.7593
/+-***-aaaaaaaa//*-a-*aaaaaaaa*-*-a*-aaaaaaaa-[18] = 0
/+-***-aaaaaaaa/a+a/a/aaaaaaaa*-*-a*-aaaaaaaa-[19] = 831.525
|
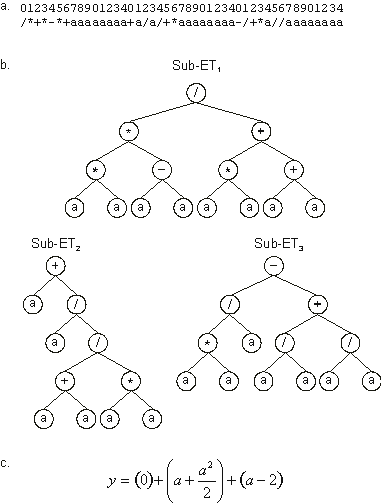
Figure 3.28. Best individual of generation 2 (chromosome 8). It has a fitness of 945.8432 evaluated against the set of fitness cases presented in
Table 3.2. a) The chromosome of the individual.
b) The sub-ETs codified by each gene. Note that sub-ET2 was already present in the best individual of generation 0 (see
Figure 3.27). c) The corresponding mathematical expression after linking with addition (the contribution of each sub-ET is shown in brackets). Note again the existence of a neutral gene (gene 1).
In the next four generations the best individuals are clones of the best individual of generation 2 or minor variations of this individual (these chromosomes are shown in
blue):
|
Generation N: 3
012345678901234012345678901234012345678901234
/*+*-*+aaaaaaaa+a/a/+*aaaaaaaa-/+*a//aaaaaaaa-[ 0] = 945.8432
/+-***-aaaaaaaa+a/a/+*aaaaaaaa*-*aa*-aaaaaaaa-[ 1] = 886.7593
*/*/**+aaaaaaaa/a/a/a/aaaaaaaa*/*-a-/aaaaaaaa-[ 2] = 789.7097
/+-***-aaaaaaaa/a+-++/aaaaaaaaa-a-a*+aaaaaaaa-[ 3] = 830.1644
/+-***-aaaaaaaa-a/a/+*aaaaaaaa*aa-a*-aaaaaaaa-[ 4] = 886.7593
/a++/--aaaaaaaa*--a/a/aaaaaaaa/++*a//aaaaaaaa-[ 5] = 558.8105
/+-***-aaaaaaaa+a/a/+*aaaaaaaa*-*/a*/aaaaaaaa-[ 6] = 352.5538
-+a-/*aaaaaaaaa-a-a+a/aaaaaaaa//-a+/-aaaaaaaa-[ 7] = 691.6004
+a/+/+/aaaaaaaa*--a-*/aaaaaaaa--/----aaaaaaaa-[ 8] = 0
/*+*-*+aaaaaaaa+a/a/+*aaaaaaaa-/+*a//aaaaaaaa-[ 9] = 945.8432
/a-*/*-aaaaaaaa+a/a/+*aaaaaaaa*-*--*-aaaaaaaa-[10] = 836.6745
/+-***-aaaaaaaa+a/a/+*aaaaaaaa*-a-a*-aaaaaaaa-[11] = 372.5987
/a++*--aaaaaaaa*/-a/a-aaaaaaaa+**a/a/aaaaaaaa-[12] = 766.7137
--a+**-aaaaaaaaaa-/aa/aaaaaaaa*/+*+*/aaaaaaaa-[13] = 420.6074
+a/+/+/aaaaaaaa*--a-*/aaaaaaaa*/+*+*-aaaaaaaa-[14] = 353.6146
-+a-/*aaaaaaaaa---a+a/aaaaaaaa-/+*a//aaaaaaaa-[15] = 611.6426
*-*-a*-aaaaaaaa/+-*a+aaaaaaaaa+**--a+aaaaaaaa-[16] = 466.7956
/*+*-*+aaaaaaaa+a/a/+*aaaaaaaa-----/*aaaaaaaa-[17] = 569.2436
/+-/*+-aaaaaaaa+a/a/+*aaaaaaaa*---a*-aaaaaaaa-[18] = 356.1858
-a-a+a/aaaaaaaa-+a-/*aaaaaaaaa+-+-+/-aaaaaaaa-[19] = 611.6426
Generation N: 4
012345678901234012345678901234012345678901234
/*+*-*+aaaaaaaa+a/a/+*aaaaaaaa-/+*a//aaaaaaaa-[ 0] = 945.8432
-+-***-aaaaaaaa-a/a/+*aaaaaaaa-----/*aaaaaaaa-[ 1] = 569.2436
/+-*-*+aaaaaaaa/a/+a/aaaaaaaaa/----/*aaaaaaaa-[ 2] = 817.2341
*/*/**+aaaaaaaa/a/a/a/aaaaaaaa-/+-a-/aaaaaaaa-[ 3] = 779.7097
/*+***-aaaaaaaa/a+--+/aaaaaaaaa-a-a*+aaaaaaaa-[ 4] = 750.3948
/*+*-*+aaaaaaaa+a/a/+*aaaaaaaa-/+*a*/aaaaaaaa-[ 5] = 585.3681
/*+--*+aaaaaaaa+a/a/+*aaaaaaaa*/**a/-aaaaaaaa-[ 6] = 891.116
/a+-*--aaaaaaaa*/-a/a-aaaaaaaa+**a/a/aaaaaaaa-[ 7] = 766.7137
**--/a-aaaaaaaa/a/+*--aaaaaaaa*/+/+**aaaaaaaa-[ 8] = 0
/+-***-aaaaaaaa-a/a/+*aaaaaaaa*aa-a*-aaaaaaaa-[ 9] = 886.7593
/*+*-a+aaaaaaaa+a/a/+*aaaaaaaa-/+*a//aaaaaaaa-[10] = 945.8432
/*+/-*+aaaaaaaa+a/a/+*aaaaaaaa-//*a//aaaaaaaa-[11] = 945.8432
*/-a-a/aaaaaaaaaa-/aa/aaaaaaaa+**a/a/aaaaaaaa-[12] = 0
-+a-/*aaaaaaaaa-a-a+a/aaaaaaaa//-a+//aaaaaaaa-[13] = 0
+-a+-+/aaaaaaaa-a/a+a/aaaaaaaa-+a-/*aaaaaaaaa-[14] = 763.2632
/a++/--aaaaaaaa*--a-a/aaaaaaaa/+/*a/-aaaaaaaa-[15] = 0
/a++*--aaaaaaaa*/-a/a-aaaaaaaa+**a/a/aaaaaaaa-[16] = 766.7137
/*+*-*+aaaaaaaa+a/a/+*aaaaaaaa*aa-a*-aaaaaaaa-[17] = 565.8646
/*+*-*+aaaaaaaa---a+a/aaaaaaaa-//*a+/aaaaaaaa-[18] = 738.811
a+a-/*aaaaaaaaa---a+a/aaaaaaaa-/+*a//aaaaaaaa-[19] = 816.363
Generation N: 5
012345678901234012345678901234012345678901234
/*+/-*+aaaaaaaa+a/a/+*aaaaaaaa-//*a//aaaaaaaa-[ 0] = 945.8432
a+a-/--aaaaaaaa-a/a/+*aaaaaaaa*aa-a*-aaaaaaaa-[ 1] = 945.5575
/*+*-*+aaaaaaaa+a/a/+*aaaaaaaa*aa-a*-aaaaaaaa-[ 2] = 565.8646
/*+*-*+aaaaaaaa---a+a-aaaaaaaa*-a-a*-aaaaaaaa-[ 3] = 367.2566
-+-***-aaaaaaaa-a/a/+*aaaaaaaa---*a++aaaaaaaa-[ 4] = 564.0838
aa/a/+*aaaaaaaa/+-***/aaaaaaaa///-*/*aaaaaaaa-[ 5] = 819.3729
/*+*-*+aaaaaaaa/a/+a/aaaaaaaaa*aa-a*-aaaaaaaa-[ 6] = 758.7488
+-a+-+/aaaaaaaa-a/a+a/aaaaaaaa-+a-/*aaaaaaaaa-[ 7] = 763.2632
/*+*-*+aaaaaaaa++/a-+*aaaaaaaa-/+aa//aaaaaaaa-[ 8] = 798.3864
/a+-*--aaaaaaaa*/-a/aaaaaaaaaa+**a/a/aaaaaaaa-[ 9] = 799.0481
/a+-*--aaaaaaaa*/-aaa-aaaaaaaa*aa-a*-aaaaaaaa-[10] = 747.9244
-/+*a//aaaaaaaaa*+*-*+aaaaaaaa+aa/+*aaaaaaaaa-[11] = 754.3026
/+-***aaaaaaaaa---a+a/aaaaaaaa-/+*a//aaaaaaaa-[12] = 803.7867
*/*/**/aaaaaaaa/a/a/a/aaaaaaaa-/+-a-/aaaaaaaa-[13] = 816.5905
a+a-/*aaaaaaaaa---a+a+aaaaaaaa-/+*a//aaaaaaaa-[14] = 785.1168
/*+*-*+aaaaaaaa+a/a/+*aaaaaaaa--+*a//aaaaaaaa-[15] = 568.9833
/*+*-*+aaaaaaaa/a/a/+*aaaaaaaa*aa-a*-aaaaaaaa-[16] = 721.8472
a+a-/*aaaaaaaaa---a+//aaaaaaaa+*-/+*aaaaaaaaa-[17] = 752.1143
/*+*-**aaaaaaaa*a/a/+*aaaaaaaa-/+*a//aaaaaaaa-[18] = 408.8309
/+-***-aaaaaaaa-a/a/+*aaaaaaaa+**a/a/aaaaaaaa-[19] = 593.1216
Generation N: 6
012345678901234012345678901234012345678901234
/*+/-*+aaaaaaaa+a/a/+*aaaaaaaa-//*a//aaaaaaaa-[ 0] = 945.8432
/*+*--+aaaaaaaa/a/a/+*aaaaaaaa*aa-a*-aaaaaaaa-[ 1] = 721.8472
---*a++aaaaaaaa-+aa-+*aaaaaaaa*aa-**-aaaaaaaa-[ 2] = 752.1143
a+a-/*aaaaaaaaa---a+a+aaaaaaaa-/a*a//aaaaaaaa-[ 3] = 817.4047
/+-***aaaaaaaaa---a/a/aaaaaaaa+aa/+*aaaaaaaaa-[ 4] = 800.2618
*/+*a//aaaaaaaaa*a*-*+aaaaaaaa-aa/+*aaaaaaaaa-[ 5] = 789.7097
/*+*-*+aaaaaaaa++/a-+*aaaaaaaa-/+aa//aaaaaaaa-[ 6] = 798.3864
a//a/+*aaaaaaaa/a*a/+aaaaaaaaa/a/-//*aaaaaaaa-[ 7] = 817.1696
a+a-/*-aaaaaaaa-a/a/**aaaaaaaa-a/a/+*aaaaaaaa-[ 8] = 594.5831
-/**a//aaaaaaaaa*+*-*+aaaaaaaa+/+*a//aaaaaaaa-[ 9] = 796.5607
aa/a/+*aaaaaaaa/+-**a/aaaaaaaa///-*/*aaaaaaaa-[10] = 783.2302
*a*a/+*aaaaaaaa-a/aa+aaaaaaaaa---*a++aaaaaaaa-[11] = 778.0015
a+a-/-aaaaaaaaa---a+a+aaaaaaaa-/+*a//aaaaaaaa-[12] = 785.1168
-+-***-aaaaaaaa-a/a/+*aaaaaaaa-/-*a++aaaaaaaa-[13] = 945.5575
/*+*-*+aaaaaaaa/+-***/aaaaaaaa*aa-a*-aaaaaaaa-[14] = 708.8708
a+a-/--aaaaaaaa-a/a/+*aaaaaaaa*a-/--aaaaaaaaa-[15] = 594.5831
/*+*-*+aaaaaaaa/a/a/+*aaaaaaaa//a-a*-aaaaaaaa-[16] = 818.3482
-+-***-aaaaaaaa/*+*-**aaaaaaaa-/+*a//aaaaaaaa-[17] = 760.707
/+-***-aaaaaaaa-a/a/+*aaaaaaaa*+**a/aaaaaaaaa-[18] = 374.7753
a+a-/*aaaaaaaaa---a+a+aaaaaaaa-/+*a//aaaaaaaa-[19] = 785.1168
|
In generation 7 a new individual was created that exhibited an improvement in fitness (chromosome 12). Its expression is shown in
Figure 3.29. The whole population is shown below:
|
Generation N: 7
012345678901234012345678901234012345678901234
/*+/-*+aaaaaaaa+a/a/+*aaaaaaaa-//*a//aaaaaaaa-[ 0] = 945.8432
/*+/-*+aaaaaaaa/+-**a/aaaaaaaa///-*/*aaaaaaaa-[ 1] = 800.2618
/+-*-*-aaaaaaaa-a/a*+*aaaaaaaa*+**a/aaaaaaaaa-[ 2] = 356.2026
---*a++aaaaaaaa-a*a/+aaaaaaaaa-/-*a++aaaaaaaa-[ 3] = 701.6004
/a/-//-aaaaaaaaa//a/+*aaaaaaaa/**a/+-aaaaaaaa-[ 4] = 0
a+a-/--aaaaaaaa+a*a/+aaaaaaaaa/+/-a/*aaaaaaaa-[ 5] = 360.1841
a+a-/-aaaaaaaaa---a+a+aaaaaaaa-/+*a//aaaaaaaa-[ 6] = 785.1168
/+-***-aaaaaaaa-a/a/+*aaaaaaaa-/-*a++aaaaaaaa-[ 7] = 610.0637
///a*+*aaaaaaaa-a/a/+*aaaaaaaa/a/-//*aaaaaaaa-[ 8] = 621.5726
/*+*---aaaaaaaa/a/a/+*aaaaaaaa**a-**-aaaaaaaa-[ 9] = 0
/+a/a/+aaaaaaaa-a/a/+*aaaaaaaa-**/-*aaaaaaaaa-[10] = 333.7551
/*+/-*+aaaaaaaa+a/a/+*aaaaaaaa-//*a//aaaaaaaa-[11] = 945.8432
aa/a/+*aaaaaaaa+a/a/+*aaaaaaaa-//*a//aaaaaaaa-[12] = 989.9987
a+-***-aaaaaaaa-+aa-+*aaaaaaaa*aa-a--aaaaaaaa-[13] = 789.7097
/*+*+-+aaaaaaaa/+/+/+*aaaaaaaa*aa-a*-aaaaaaaa-[14] = 388.9994
/+-***-aaaaaaaa-a/a/+*aaaaaaaa+***+**aaaaaaaa-[15] = 343.4301
/*+*-*+aaaaaaaa++/a-+*aaaaaaaa-/+aa//aaaaaaaa-[16] = 798.3864
aa/a/+*aaaaaaaa/+-a*a/aaaaaaaa////*/*aaaaaaaa-[17] = 805.9502
---*a++aaaaaaaa-aa+aa-aaaaaaaa*aa-**-aaaaaaaa-[18] = 471.685
a/-a/+*aaaaaaaa-a/-/+aaaaaaaaa*a-/--aaaaaaaaa-[19] = 816.5905
|
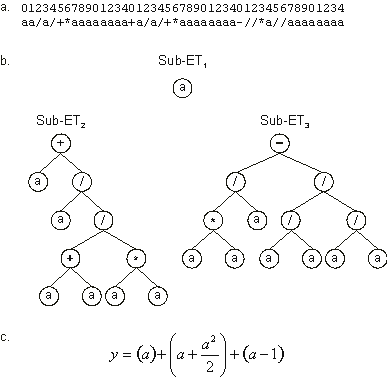
Figure 3.29. Best individual of generation 7 (chromosome 12). It has a fitness of 989.9987 evaluated against the set of fitness cases presented in
Table 3.2. a) The chromosome of the individual.
b) The sub-ETs codified by each gene. Note that sub-ET2 was already present in the previous best of generation individuals.
c) The corresponding mathematical expression after linking with addition (the contribution of each sub-ET is shown in brackets).
In the next two generations no improvement in fitness occurred:
|
Generation N: 8
012345678901234012345678901234012345678901234
aa/a/+*aaaaaaaa+a/a/+*aaaaaaaa-//*a//aaaaaaaa-[ 0] = 989.9987
a+a-/-aaaaaaaaa---a+a+aaaaaaaa-/+*a//aaaaaaaa-[ 1] = 785.1168
/*+/-/+aaaaaaaa+a/a/+*aaaaaaaa-//+a//aaaaaaaa-[ 2] = 889.116
aa/a/+*aaaaaaaa/a/a/+*aaaaaaaa-//*a//aaaaaaaa-[ 3] = 782.9793
a+a-/-aaaaaaaaa---a+a+aaaaaaaa-/+*a//aaaaaaaa-[ 4] = 785.1168
/*+/-*+aaaaaaaa+aaa/**aaaaaaaa-//*a++aaaaaaaa-[ 5] = 779.7097
/+-*-**aaaaaaaa-a/a*+*aaaaaaaa////*/*aaaaaaaa-[ 6] = 0
aa/a/+*aaaaaaaa+a/a/+*aaaaaaaa-//*a//aaaaaaaa-[ 7] = 989.9987
++/a-+*aaaaaaaa/*/a/+aaaaaaaaa/a/-//*aaaaaaaa-[ 8] = 794.4986
/*+/-*+aaaaaaaa+a/a/+*aaaaaaaa-//*a//aaaaaaaa-[ 9] = 945.8432
///a*+-aaaaaaaa-a+*-*+aaaaaaaa-/+aa//aaaaaaaa-[10] = 0
/a+/-*+aaaaaaaa/*+/-*+aaaaaaaa+a/a/+*aaaaaaaa-[11] = 886.7593
/*+/-*+aaaaaaaa/+-**a/aaaaaaaa///-*/*aaaaaaaa-[12] = 800.2618
/*+*-*+aaaaaaaa++/a-+*aaaaaaaa-/+aa//aaaaaaaa-[13] = 798.3864
/+-***-aaaaaaaa-////+*aaaaaaaa-a/*a//aaaaaaaa-[14] = 807.1407
/+-***-aaaaaaaa-a/a/+*aaaaaaaa+***+**aaaaaaaa-[15] = 343.4301
a/-a/+*aaaaaaaa-a/-/+*aaaaaaaa*a-/--aaaaaaaaa-[16] = 730.5334
/+-***-aaaaaaaa-a*a/++aaaaaaaa*/*a+**aaaaaaaa-[17] = 355.8565
aa/a/+*aaaaaaaa+a/a/+*aaaaaaaa-//*a//aaaaaaaa-[18] = 989.9987
///a*+*aaaaaaaa-a/a/+*aaaaaaaa/a/-//*aaaaaaaa-[19] = 621.5726
Generation N: 9
012345678901234012345678901234012345678901234
aa/a/+*aaaaaaaa+a/a/+*aaaaaaaa-//*a//aaaaaaaa-[ 0] = 989.9987
/*+/-*+aaaaaaaa+aaa/**aaaaaaaa-//*a++aaaaaaaa-[ 1] = 779.7097
aa/a++*aaaaaaaa/a/a/+*aaaaaaaa-/+/*a/aaaaaaaa-[ 2] = 788.0954
a+a-/-aaaaaaaaa---a+a+aaaaaaaa/*+/-*+aaaaaaaa-[ 3] = 816.5905
++/a-+*aaaaaaaa-////+*aaaaaaaa/a/-//*aaaaaaaa-[ 4] = 819.1696
+aaa/+*aaaaaaaa-/-/a+/aaaaaaaa-/+-a-/aaaaaaaa-[ 5] = 817.4047
/+-***-aaaaaaaa-//-/+*aaaaaaaa-//*a//aaaaaaaa-[ 6] = 805.3593
aa/a/+*aaaaaaaa/a/a/+*aaaaaaaa-a/*a/-aaaaaaaa-[ 7] = 791.2383
/*+/-*+aaaaaaaa+aaa/**aaaaaaaa-//a*++aaaaaaaa-[ 8] = 789.0481
/aaa+-*aaaaaaaa-a/-/+*aaaaaaaa*a-/--aaaaaaaaa-[ 9] = 697.6004
/+-***-aaaaaaaa-a/a/+*aaaaaaaa+***+**aaaaaaaa-[10] = 343.4301
aa/a/+*aaaaaaaa/a/a/+*aaaaaaaa-//*a/aaaaaaaaa-[11] = 799.0481
a+a-/-aaaaaaaaa---a+a+aaaaaaaa+/+*a//aaaaaaaa-[12] = 817.6932
/*++-*+aaaaaaaa/+***a/aaaaaaaa///*a/*aaaaaaaa-[13] = 370.8166
/*+*-*+aaaaaaaa++/a-+*aaaaaaaa-/+aa//aaaaaaaa-[14] = 798.3864
/*+/-*+aaaaaaaa/+-*-a*aaaaaaaa///-*/*aaaaaaaa-[15] = 812.4845
a+a-/-aaaaaaaaa---a+a+aaaaaaaa//-*a//aaaaaaaa-[16] = 0
a*/a/+*aaaaaaaa+a/a/+*aaaaaaaa-//*a//aaaaaaaa-[17] = 989.9987
-//*a//aaaaaaaa/a//a/+aaaaaaaa/a/a/+*aaaaaaaa-[18] = 327.7421
/*+/-/+aaaaaaaa+a/a/+*aaaaaaaa-//+a//aaaaaaaa-[19] = 889.116
|
Finally, by generation 10 an individual with maximum fitness was created:
|
Generation N: 10
012345678901234012345678901234012345678901234
a*/a/+*aaaaaaaa+a/a/+*aaaaaaaa-//*a//aaaaaaaa-[ 0] = 989.9987
+/+a-//aaaaaaaa/*+*-*+aaaaaaaa++/a-+*aaaaaaaa-[ 1] = 0
/*+/-*+aaaaaaaa+a///+*aaaaaaaa/a/-//*aaaaaaaa-[ 2] = 800.3348
/*+/-*aaaaaaaaa+-aa/**aaaaaaaa-//-a++aaaaaaaa-[ 3] = 785.1168
/+aa/a/aaaaaaaa+a/a/+*aaaaaaaa///-*/*aaaaaaaa-[ 4] = 886.7593
/+-*-**aaaaaaaa-/+-/+*aaaaaaaa-//*a//aaaaaaaa-[ 5] = 0
-//*a++aaaaaaaa/*+/-*+aaaaaaaa*+aaa/*aaaaaaaa-[ 6] = 474.2741
a+a-/-aaaaaaaaa---a+a+aaaaaaaa-//*a/aaaaaaaaa-[ 7] = 796.9538
aa/a/+*aaaaaaaa/a/a/**aaaaaaaa--/*a/-aaaaaaaa-[ 8] = 0
a+a/+/+aaaaaaaa+a-a/+*aaaaaaaa//+/-*+aaaaaaaa-[ 9] = 0
a*/a/+*aaaaaaaa+a/a/+*aaaaaaaa-//*a//aaaaaaaa-[10] = 989.9987
-*/a/+*aaaaaaaa+a/a/+*aaaaaaaa-///-*+aaaaaaaa-[11] = 0
a*/a/+*aaaaaaaa+a/a/+*aaaaaaaa///*a//aaaaaaaa-[12] = 1000
a+a-/*aaaaaaaaa-+-a+a+aaaaaaaa/*+*a//aaaaaaaa-[13] = 381.2412
aa/a/+*aaaaaaaa+a/a/+*aaaaaaaa-//*a+/aaaaaaaa-[14] = 891.116
a+a-/-aaaaaaaaa---*+a+aaaaaaaa+/+*a//aaaaaaaa-[15] = 738.8981
aa/a/+*aaaaaaaa/aaa/**aaaaaaaa-//*a++aaaaaaaa-[16] = 804.8516
++/a-+*aaaaaaaa-//a/+*aaaaaaaa-/+*a//aaaaaaaa-[17] = 769.7097
/*+/-*+aaaaaaaa/+-*-a*aaaaaaaa-//*a//aaaaaaaa-[18] = 798.2679
/*+-/-aaaaaaaaa---a+a+aaaaaaaa-//+a-/aaaaaaaa-[19] = 829.525
|
Note that the best individual of this generation is a descendant, via mutation, of the best individual of the previous generation: their chromosomes only differ in one position (the “-” at position 0 in gene 3 was replaced by “/”). The expression of this chromosome with maximum fitness shows that it codes for a perfect solution to the problem at hand
(Figure 3.30).
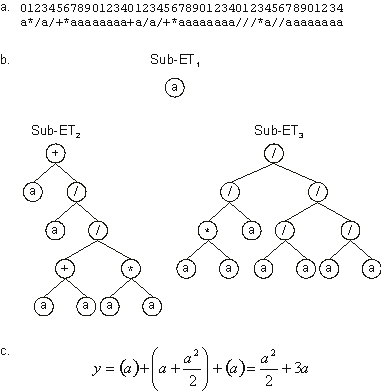
Figure 3.30. Perfect solution to the simple problem of symbolic regression. This program was found on generation 8 and has maximum fitness.
a) The chromosome of the individual. b) The sub-ETs codified by each gene. Note that
sub-ET1 and sub-ET2 were already present in the previous best of generation solution (see
Figure 3.29), and sub-ET2 has an even longer pedigree, going back to the initial population.
c) The corresponding mathematical expression after linking with addition (the contribution of each sub-ET is shown in brackets). Note that it matches exactly the target function
(3.3).
So, we have seen how a random collection of random chromosomes grew into mature programs, giving their first tentative steps in a hostile environment. These humble individuals were then selected to reproduce with modification, creating new individuals that adapted quickly and incredibly well in this environment. This wondrous adaptation is made possible by the blind modification on the genomes carried out by the genetic operators and the inexorable hand of selection. In the next chapters we will see how these principles can be efficiently applied to solve a great variety of complex problems.
|


