In this section we are going to explore the fundamental steps in time series analysis. Specifically, we are going to predict sunspots, but we could be predicting anything from financial markets to the price of peanuts for all such tasks are solved using exactly the same time series framework.
Time series analysis is a special case of symbolic regression and, therefore, can be easily done using the familiar framework of GEP. Indeed, one has only to prepare the data to fit a normal symbolic regression task. For this problem, we are going to use the sunspots time series of
Table 4.5. A different way of representing this time series is shown in
Figure 4.10. Let’s see then how the data should be prepared for time series analysis.
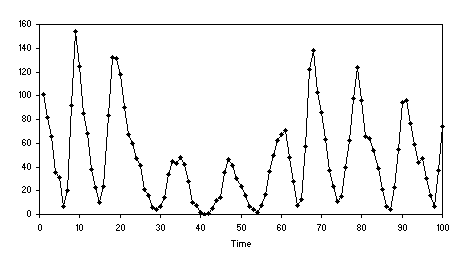
Figure 4.10. Wolfer sunspots series (see also
Table 4.5).
The data represent a series of observations taken at certain intervals, a year in this case. The idea behind time series prediction is that past observations determine future ones. This means that, in practical terms, one is trying to find a prediction model that is a function of a certain number of past observations. This certain number of past observations is what is called the embedding dimension
d in time series analysis jargon. For the sunspots prediction task we are going to use
d = 10. There is also another important parameter in time series analysis – the delay time
t – that determines how data are processed. A delay time of one means that the data are processed continuously, whereas higher values of
t indicate that some observations are skipped. For instance, using d = 10 and
t = 1, the sunspots series of Table
4.5 gives:
| |
t-10 |
t-9 |
t-8 |
t-7 |
t-6 |
t-5 |
t-4 |
t-3 |
t-2 |
t-1 |
t |
| 1. |
101 |
82 |
66 |
35 |
31 |
7 |
20 |
92 |
154 |
125 |
85 |
| 2. |
82 |
66 |
35 |
31 |
7 |
20 |
92 |
154 |
125 |
85 |
68 |
| 3. |
66 |
35 |
31 |
7 |
20 |
92 |
154 |
125 |
85 |
68 |
38 |
| … |
... |
... |
... |
... |
... |
...
|
... |
... |
... |
... |
... |
| 89. |
55 |
94 |
96 |
77 |
59 |
44 |
47 |
30 |
16 |
7 |
37 |
| 90. |
94 |
96 |
77 |
59 |
44 |
47 |
30 |
16 |
7 |
37 |
74 |
In all the time series experiments of this book we are going to use an embedding dimension of 10 and a delay time of one. As you can see, the time series data is now ready to be used in a normal symbolic regression analysis, where
(t-10) through (t-1) are the independent variables and
t is the dependent variable.
In real-world prediction tasks the goal is to find a model and then use that model to make predictions. And the model is usually put to test the next day or hour, depending on the frequency of the observations. But here we can simulate a real situation using only the first 80 observations of the Wolfer sunspots to evolve the model (training) and the last 10 for prediction (testing). This way we will be able to evaluate the accuracy of the predictions made by the model evolved by GEP.
So, let’s try to find a model to explain and predict sunspots. A good starting point would be to choose the kind of parameters used in the sunspots experiment that produced the best results
(Table 4.10, column 2). Then, with the software APS, through a series of optimization runs, one exploits the current chromosomal structure to the fullest, that is, until the system stops improving. Then a neutral gene is added to the system and again the system is exploited to the fullest, and so forth until the introduction of another neutral gene no longer gives an edge to the system and no improvement in best fitness is made. By and large, this kind of procedure allows one to approximate any continuous function to an arbitrary precision if there is a sufficient number of terms. Here, the added neutral genes are potential new terms and the software allows their fruitful integration in the equation. For instance, the model below was obtained using a total of five such cycles (one for each added neutral gene):
double APSCfunction(double d[ ])
{
double
dblTemp = 0;
dblTemp
+= (d[9]+((d[8]/(d[5]+d[4]))+((d[9]-d[9])*d[0])));
dblTemp
+= (d[9]/((((d[3]+d[3])+d[2])-d[9])+d[8]));
dblTemp
+= (d[9]/(d[4]+d[6]));
dblTemp
+= (d[9]/(d[4]+d[2]));
dblTemp
+= (d[5]/(d[2]-d[6]));
dblTemp
+= (d[3]/(d[1]-d[5]));
dblTemp
+= (d[1]/(d[7]-d[0]));
dblTemp
+= ((((d[2]-d[8])*d[9])+(d[0]+d[0]))/(d[7]+(d[8]+d[2])));
return
dblTemp; |
|
|
} |
(4.27) |
where d0 - d9 represent, respectively,
(t-10) - (t-1). This model has an R-square equal to 0.94974095. As shown in Figures
4.11 and 4.12, the model evolved by GEP is a good predictor. Note, in
Figure 4.12, how the most accurate predictions are the most immediate: the more one ventures into the future the less accurate they become.
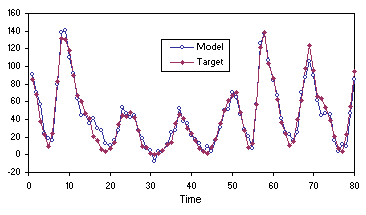
Figure 4.11. Comparing the model (4.27) evolved by GEP with the target sunspots series on the training data.
The remarkable thing about these time series prediction models (the model
(4.27) above and the models (4.13) and
(4.18) of section
4.2) is that they are all composed of simple terms involving a quotient. This is something the algorithm discovered on its own without any kind of prompting on my part and it seems to me a very creative and useful framework for time series analysis.
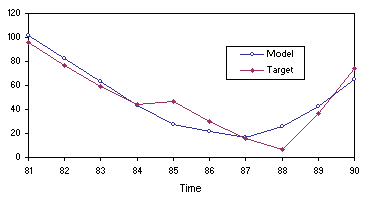
Figure 4.12. Comparing the mode (4.27) evolved by GEP with the target sunspots series on the testing data.
|